Mapping THE OCEAN floor
On the surface of the Earth, there are any landforms. These landforms include chains of volcanoes, trenches, mountain ranges, large submarine plateaus, and many other landforms that are also on land. As the topography of the continents are diverse, so is the ocean floor.
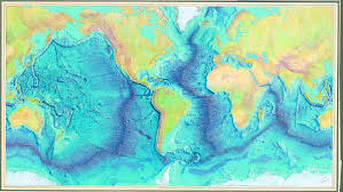
Bathyetry helps us understand where the ocean-floor features are and how deep the oceans are. Bathymetry is the measurement of ocean depths and the charting of the shape or topography of the ocean floor. Bathymetry is part of mapping the ocean floor because it is the study of beds or floors of water bodies. Bathymetric maps illustrate the land that lies underwater. Variations in sea-floor relief may be depicted by color and contour lines called depth contours or isobaths.
Maps of the ocean floor help us study past climate change for environmental prediction, understand the impact of benthic habitat on fisheries and other biological communities, to study offshore pollution patterns and mechanisms to help sustain healthy coasts, to find sources of dredged material for beach replenishment, to evaluate the impacts of proposed offshore waste disposal, to learn about and estimate the impacts of events such as gas hydrate releases related to slope stability, to locate strategic offshore mineral resources, to determine sites for seabed communications cables, drilling platforms, and other structures, to provide groundtruth values for remotely sensed/satellite data, helping refine new techniques for environmental assessment and prediction, to learn more about how the Earth and its environmental systems function.